Fernando Mendoza was QB4 and the 20th overall player on Dane Brugler's summer big board, published by The New York Times on August 21, 2025.
Garrett Nussmeier was QB3 and ranked 10th; Drew Allar was QB5 and ranked 27th; Cade Klubnik was QB6 and ranked 30th.
Then the season happened.
Arch Manning (QB1), LaNorris Sellers (QB2), and Sam Leavitt (QB7) returned to school a few short months after being projected to be Top 50 NFL prospects.
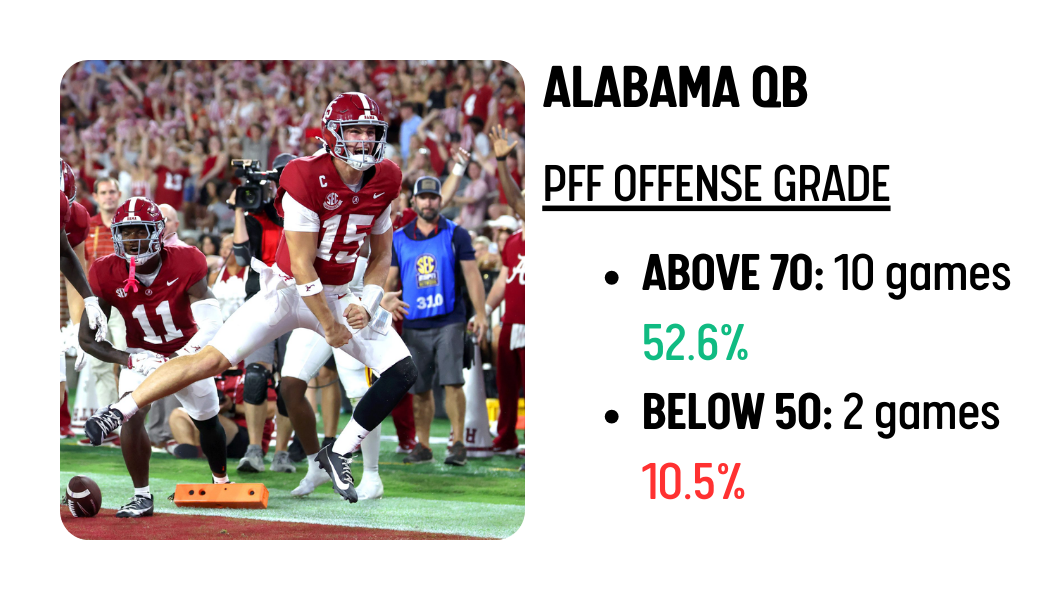
Ty Simpson, who missed the cut last summer, heads into the NFL Combine as QB2 with a chance to rise into the 1st-round discussion if things go well for him in Indianapolis.
Nussmeier is still thought to be QB3 but his stock has fallen to 80th overall on the Consensus Big Board, which combines dozens of industry rankings.
Allar is up to QB4 but now ranks 116th, while Miami's Carson Beck is QB5 ahead of North Dakota State's Cole Payton (ranked 125th and 136th) as the Combine get underway.
So, how did we get here?
How did Mendoza climb the mountaintop while the others tumbled toward Day 3?
TLDR
To try and make some sense of the fall, I turned to PFF and went digging.
I studied the quarterbacks' passing reports and fixated on their grades, trying to distill them into some sort of quick and repeatable process, then drew some lines in the sand.
This much is true. The New York Times says so.
In theory, anyway. According to me.
To provide some contrast, I arbitrarily drew the bad line at 50 to try and quickly differentiate a player's relative standouts from their stinkers.
My thinking was, in a way, that this would sort of cut out the middle meh; the replacement-level or truly average games in the prospect's sample size, which I'll get in just a second.
- Defining the sample size: Any game in which they played and received a PFF grade during their final two seasons in college, including bowl and all-star games.
- Focusing on PFF Offense grade: More representative than the weekly passing grade as it accounts for the QB's overall (dual-threat) ability.
- Tallying up the standouts: Any games in which the QB scored 70 or better in PFF Offense grade.
- Calculating the rate: Divide the sum of their standout games by their total games played to get their "Above Average Quarterback Play" rate.
Then, repeat the process to compare it to recent quarterback classes.
Here's how the 16 quarterbacks at the Combine performed in PFF Offense grade during their final two seasons; how they stacked up against each other and some recent QBs drafted from 2022-2025.
Above Average Quarterback Play
| Rank | Quarterback | Above Average Games | Rate Above (70.0+) | Rate Below (0-69.9) |
|---|---|---|---|---|
| 1 | Jayden Daniels | 22 | 84.6% | 15.4% |
| 2 | Jaxson Dart | 21 | 80.8% | 19.2% |
| 2 | Caleb Williams | 21 | 80.8% | 19.2% |
| 4 | Bo Nix | 21 | 77.8% | 22.2% |
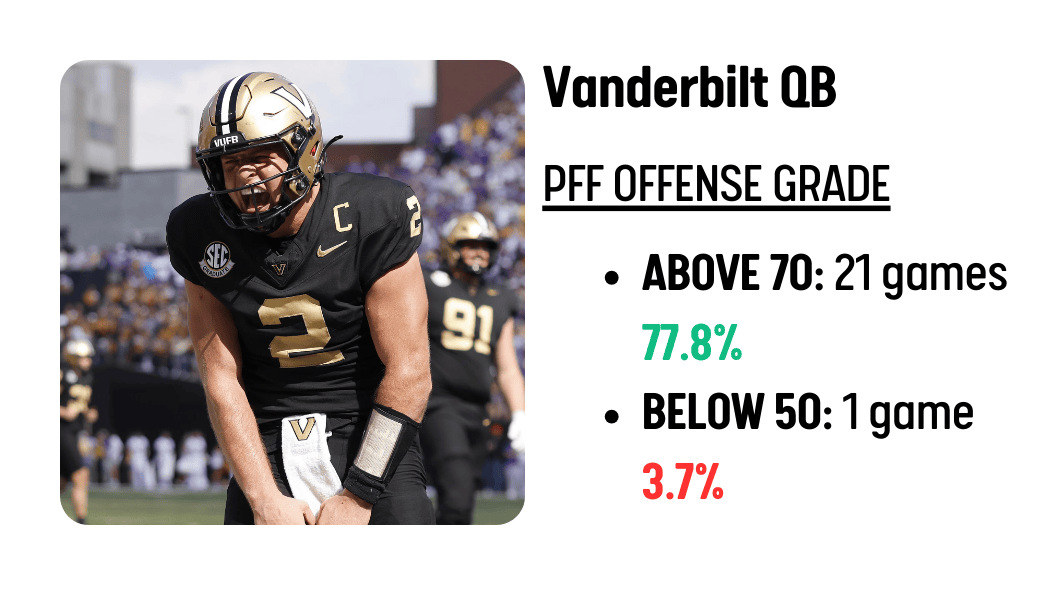
| 4 | Diego Pavia | 21 | 77.8% | 22.2% |
| 6 | Drake Maye | 20 | 76.9% | 23.1% |
| 7 | C.J. Stroud | 19 | 76.0% | 24.0% |
| 8 | Bryce Young | 20 | 74.1% | 25.9% |
| 9 | Michael Penix Jr. | 20 | 71.4% | 28.6% |
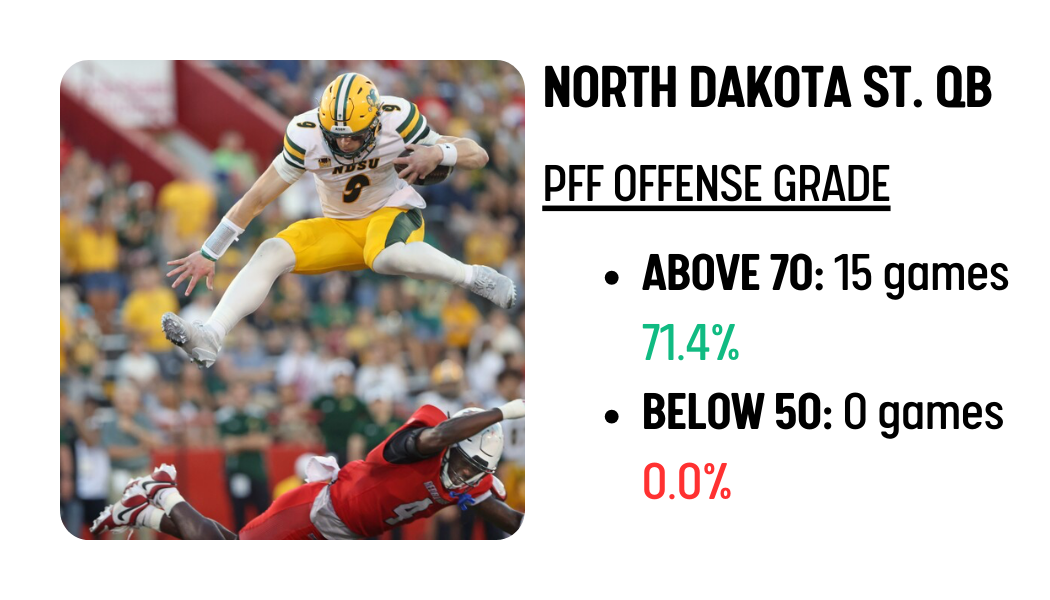
| 10 | Cole Payton | 15 | 71.2% | 28.8% |
| 11 | Malik Willis | 17 | 70.8% | 29.2% |
| 12 | Kenny Pickett | 16 | 69.6% | 30.4% |
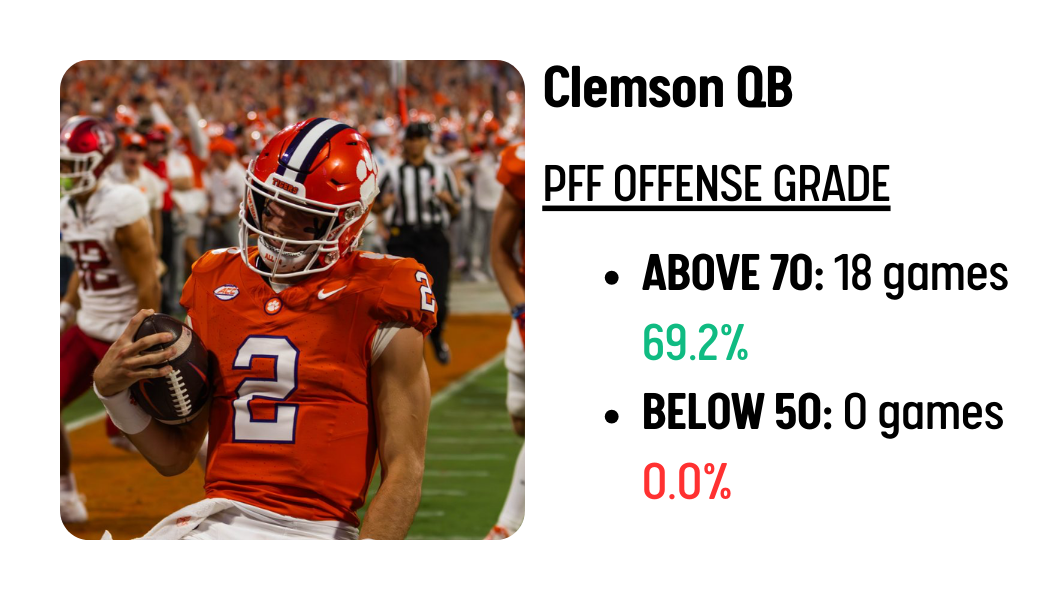
| 13 | Cade Klubnik | 18 | 69.2% | 30.8% |
| 14 | Cam Ward | 17 | 68.0% | 32.0% |
| 15 | Shedeur Sanders | 16 | 66.7% | 33.3% |
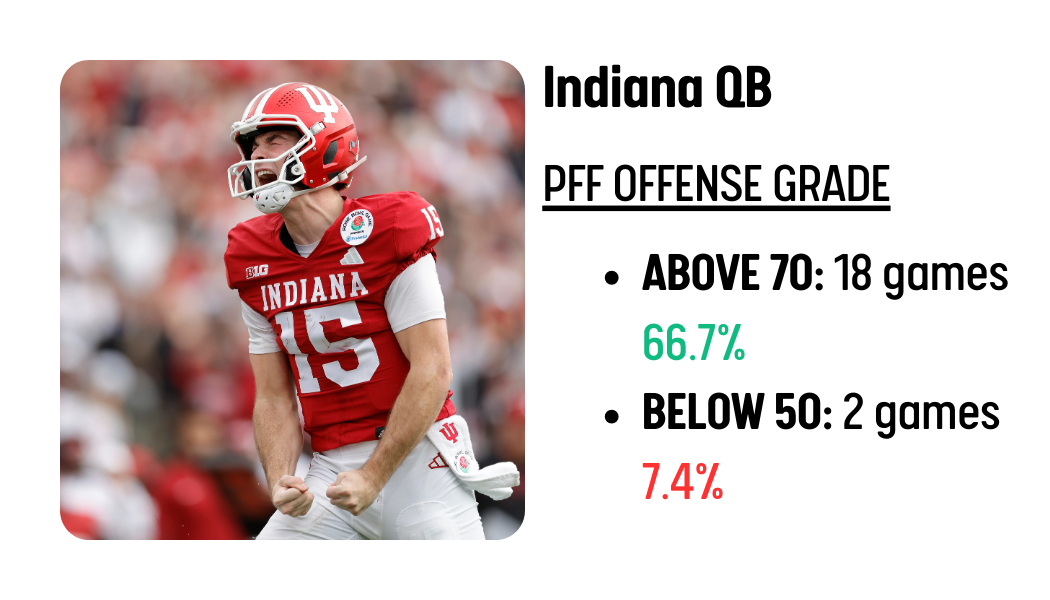
| 15 | Fernando Mendoza | 18 | 66.7% | 33.3% |
---- The Mendoza Line ---- Pass/Fail ---- 65.0% -----
| Rank | Quarterback | Above Average Games | Rate Above (70.0+) | Rate Below (0-69.9) |
|---|---|---|---|---|
| 17 | Dillon Gabriel | 17 | 63.0% | 37.0% |
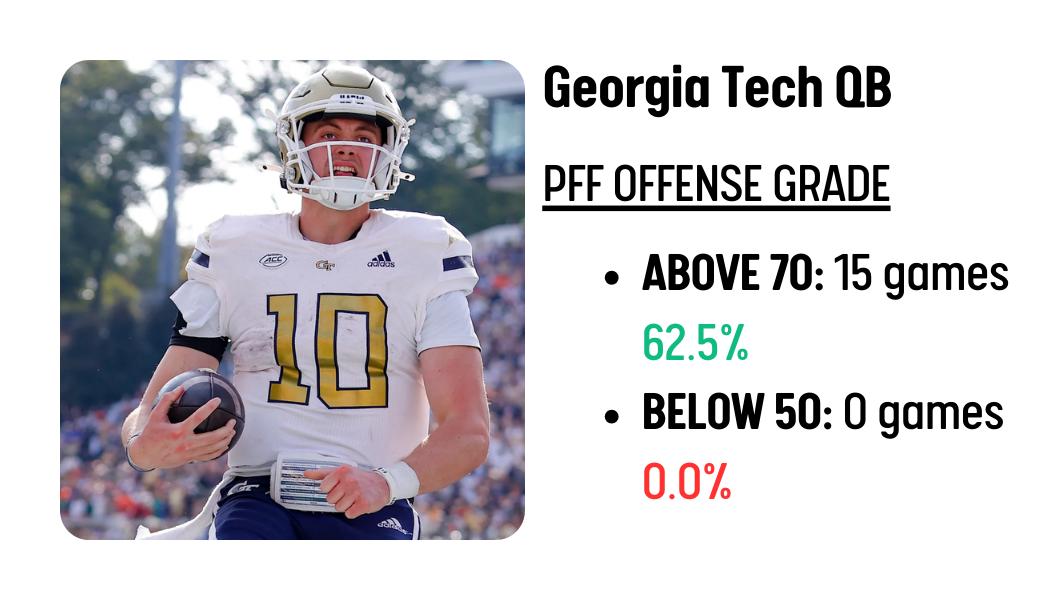
| 18 | Haynes King | 15 | 62.5% | 37.5% |
| 19 | J.J. McCarthy | 18 | 62.1% | 37.9% |
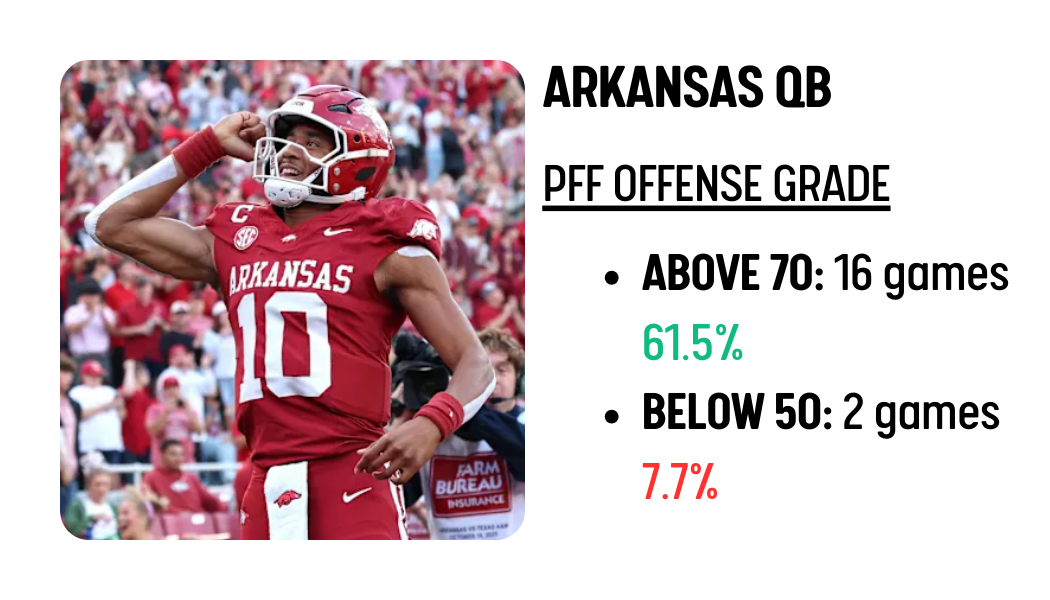
| 20 | Taylen Green | 16 | 61.5% | 38.5% |
| 21 | Tyler Shough | 10 | 58.8% | 41.2% |
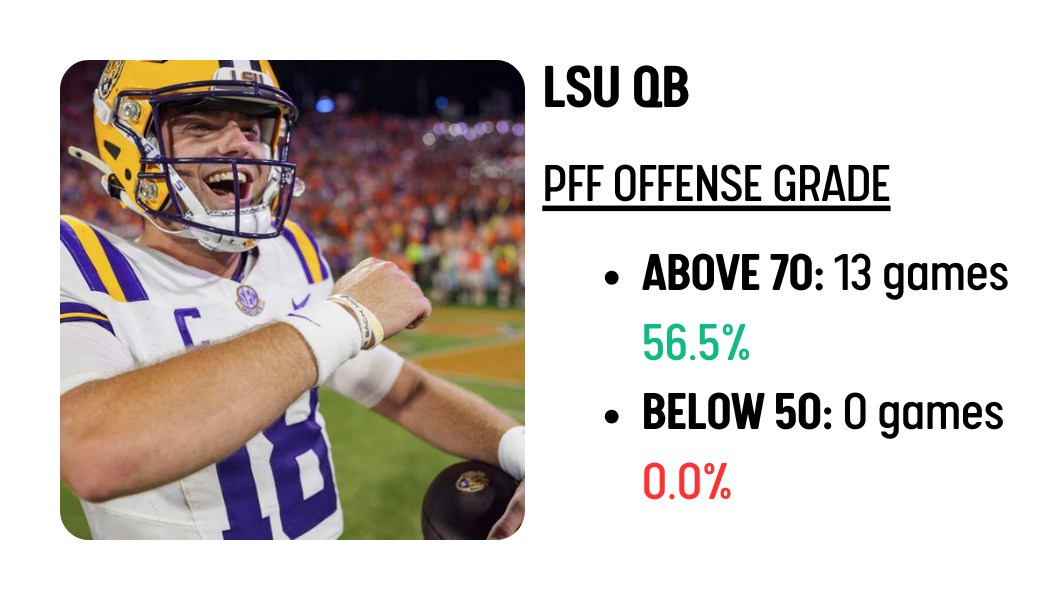
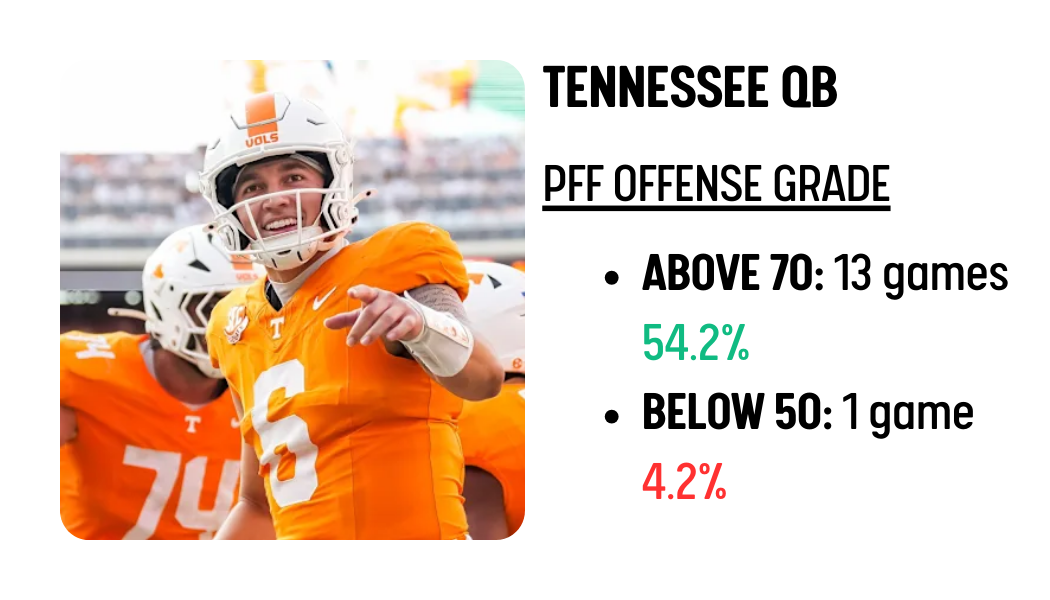
| 22 | Garrett Nussmeier | 13 | 56.5% | 43.5% |
| 23 | Joey Aguilar | 13 | 54.2% | 45.8% |
| 24 | Anthony Richardson | 10 | 52.6% | 47.4% |
| 24 | Ty Simpson | 10 | 52.6% | 47.4% |
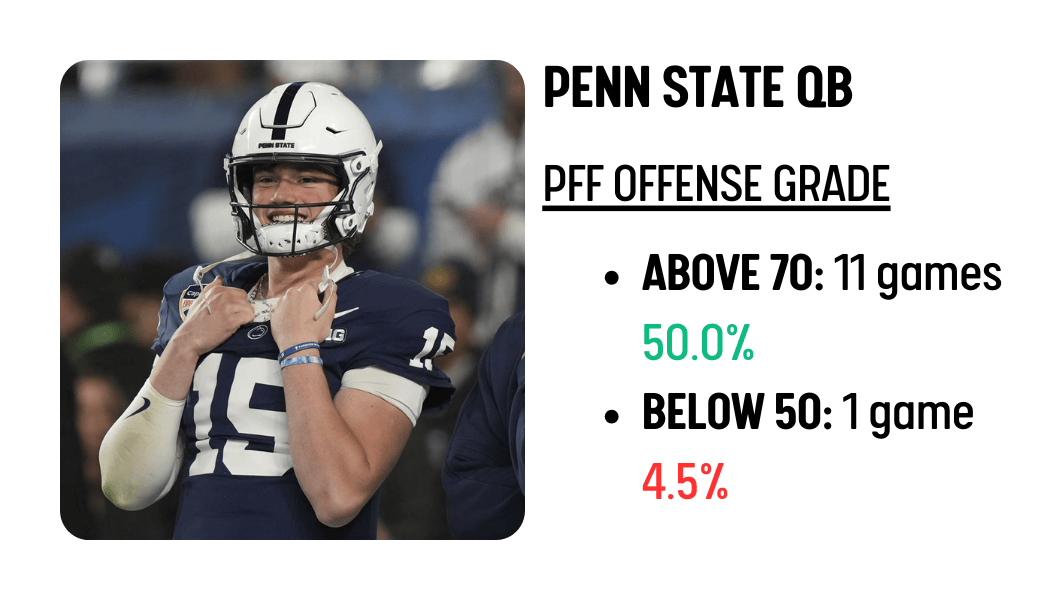
| 26 | Drew Allar | 11 | 50.0% | 50.0% |
| 27 | Carson Beck | 14 | 48.3% | 51.7% |
| 28 | Luke Altmyer | 13 | 48.1% | 51.9% |
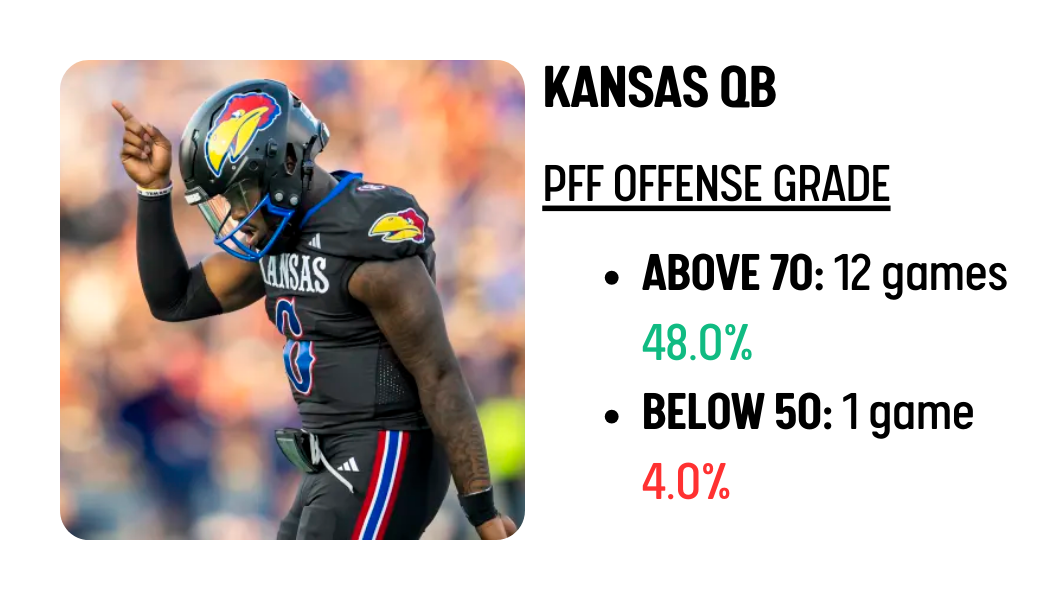
| 29 | Jalon Daniels | 12 | 48.0% | 52.0% |
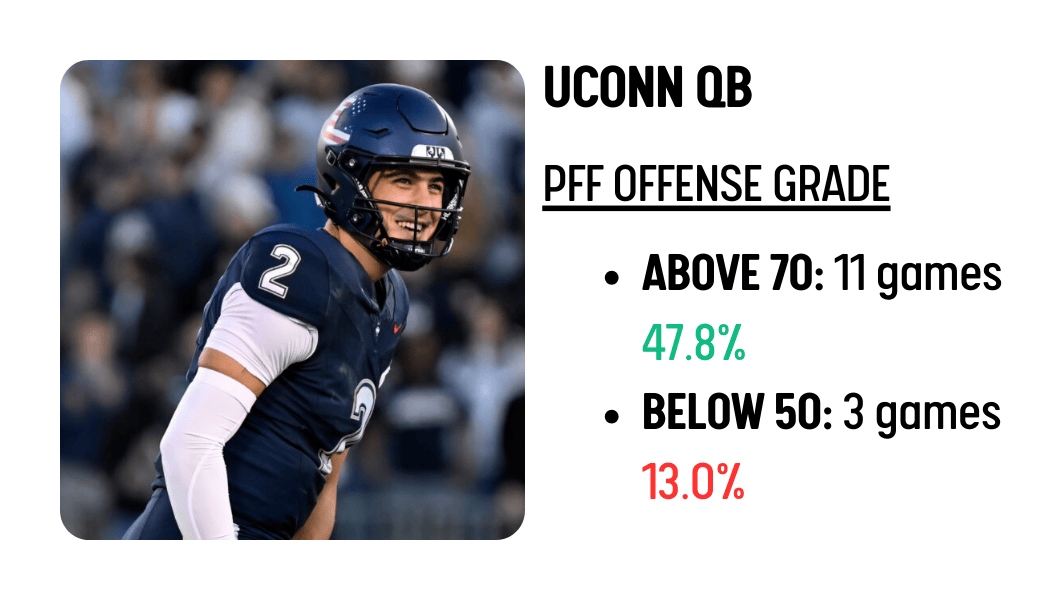
| 30 | Joe Fagnano | 11 | 47.8% | 52.2% |
| 31 | Will Levis | 11 | 45.8% | 54.2% |
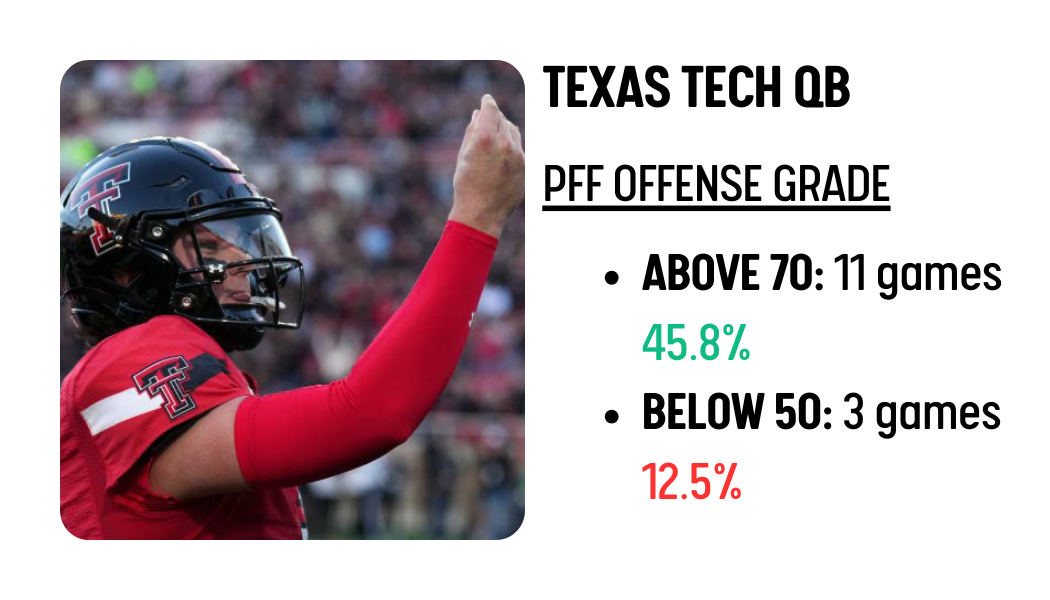
| 31 | Behren Morton | 11 | 45.8% | 54.2% |
| 33 | Brock Purdy | 11 | 42.3% | 57.7% |
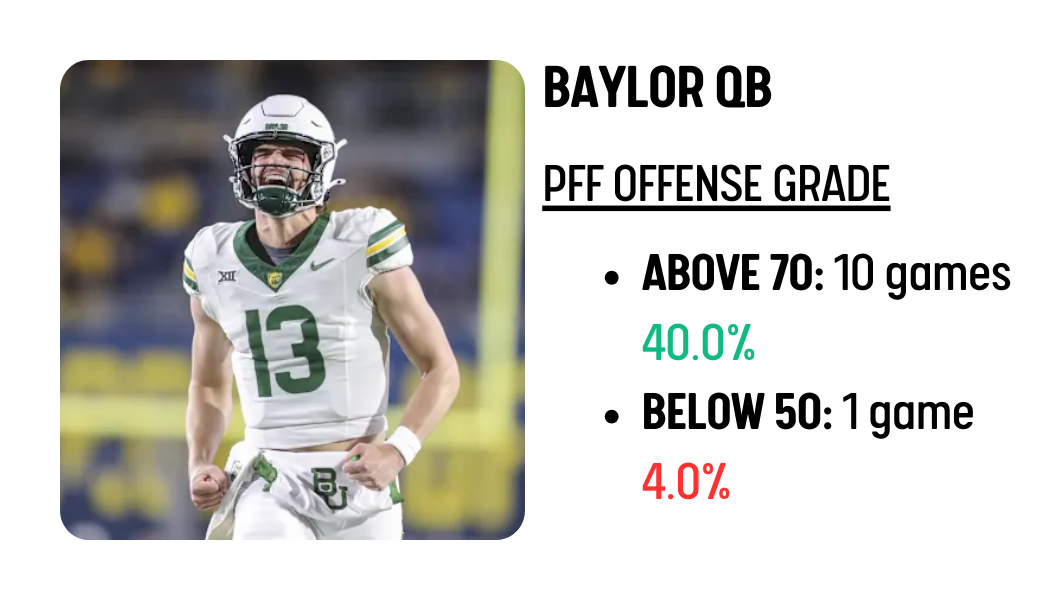
| 34 | Sawyer Robertson | 10 | 40.0% | 60.0% |
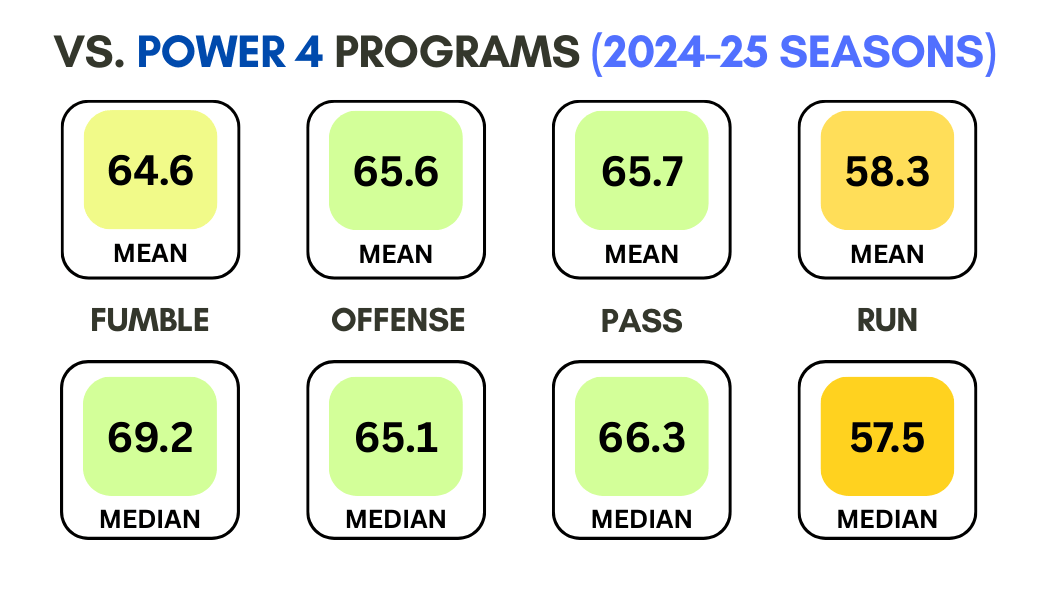
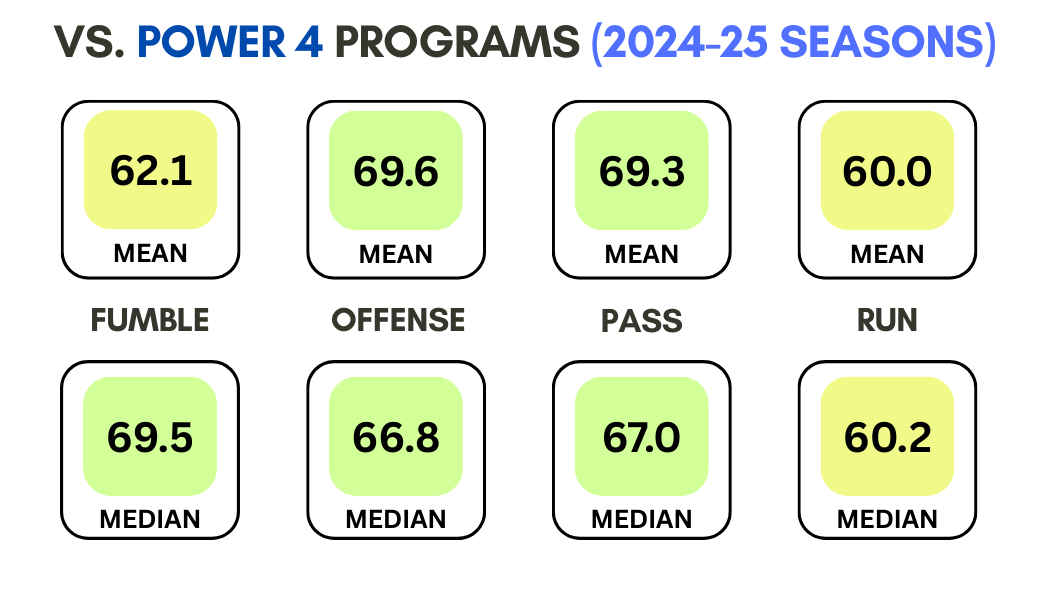
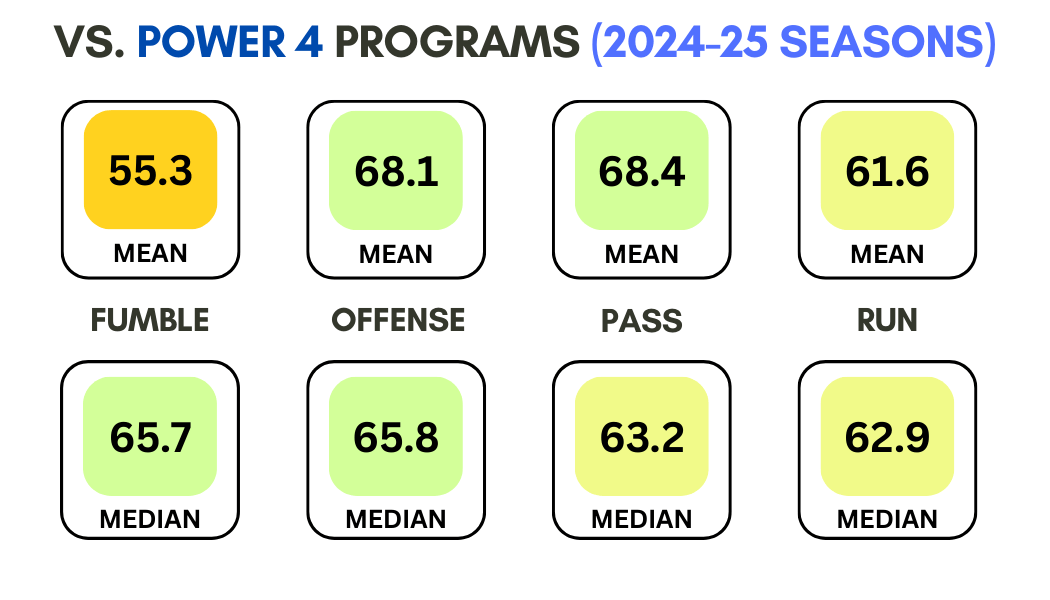
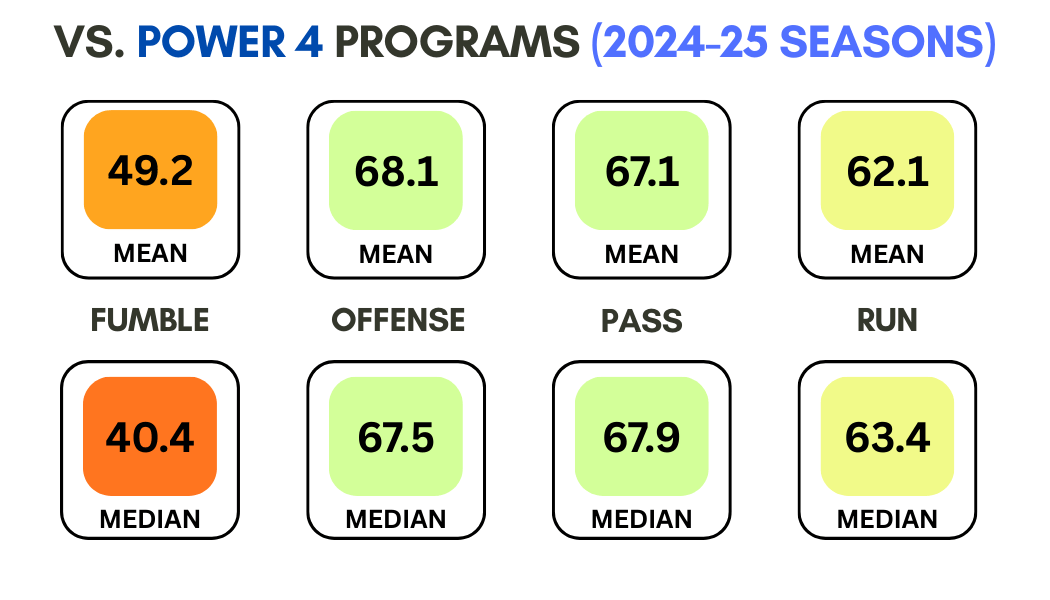
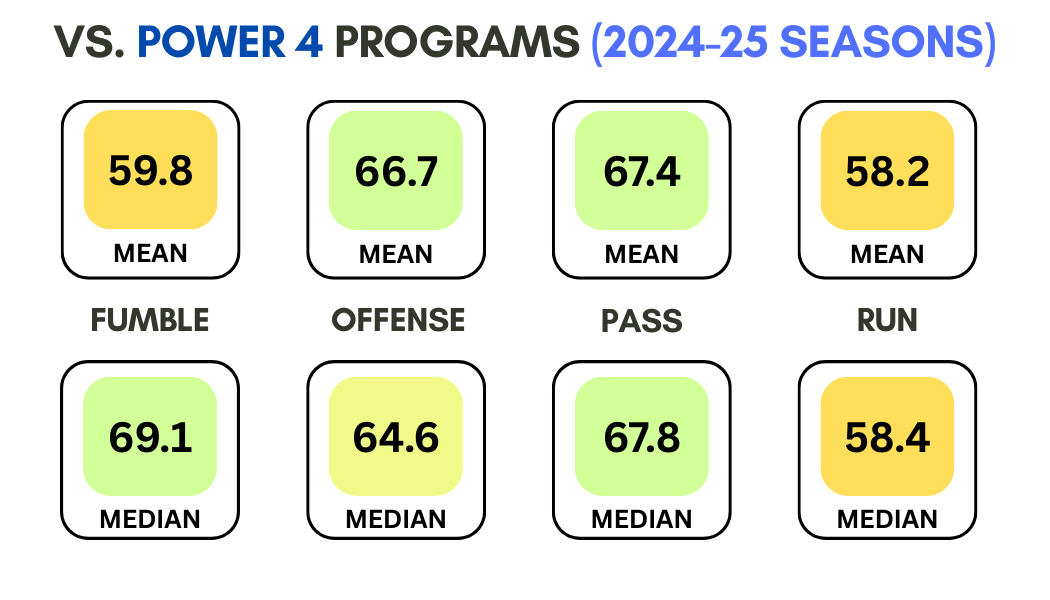
How did the 2026 QBs perform against top competition?
The following list provides a snapshot of the four PFF grades in each quarterback's weekly passing report: 1.) Offense, 2). Passing, 3.) Rushing, 4.) and Hands (or Fumbling).
Hands grades are more about why the fumble occurred (i.e. an unavoidable strip sack or a foolish lateral) than if the fumble resulted in a turnover (whether or not they were able to maintain possession isn't factored into the grade).
- Mean: The average grade in the sample set.
- Median: 50% of the quarterback's games in the sample were above the grade that is shown and the other 50% were below.
A higher median could indicate the quarterback had fewer stinkers than the mean might have led you to believe.
Diego Pavia
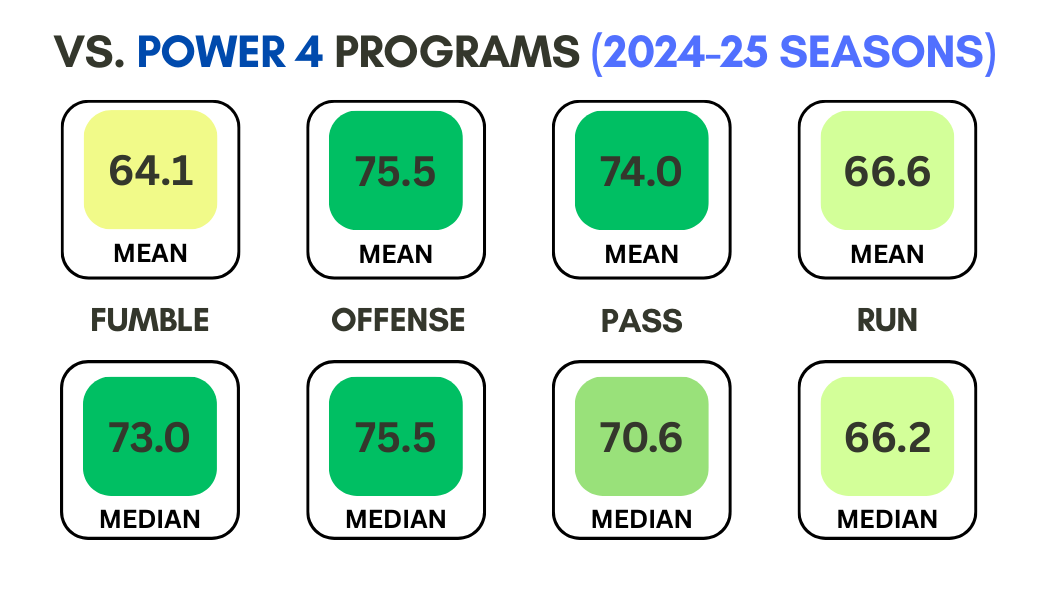
Fernando Mendoza
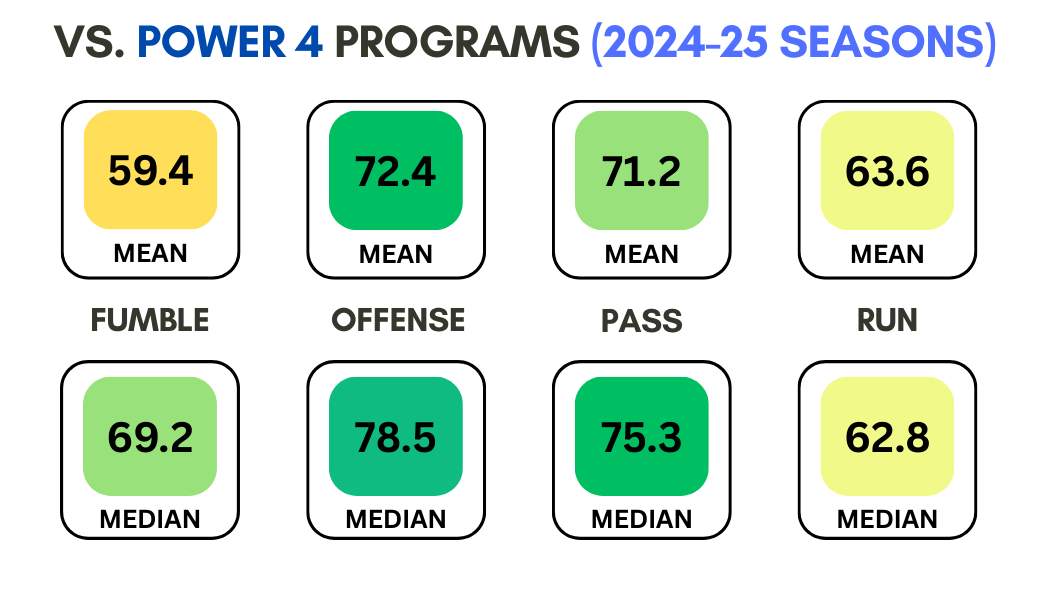
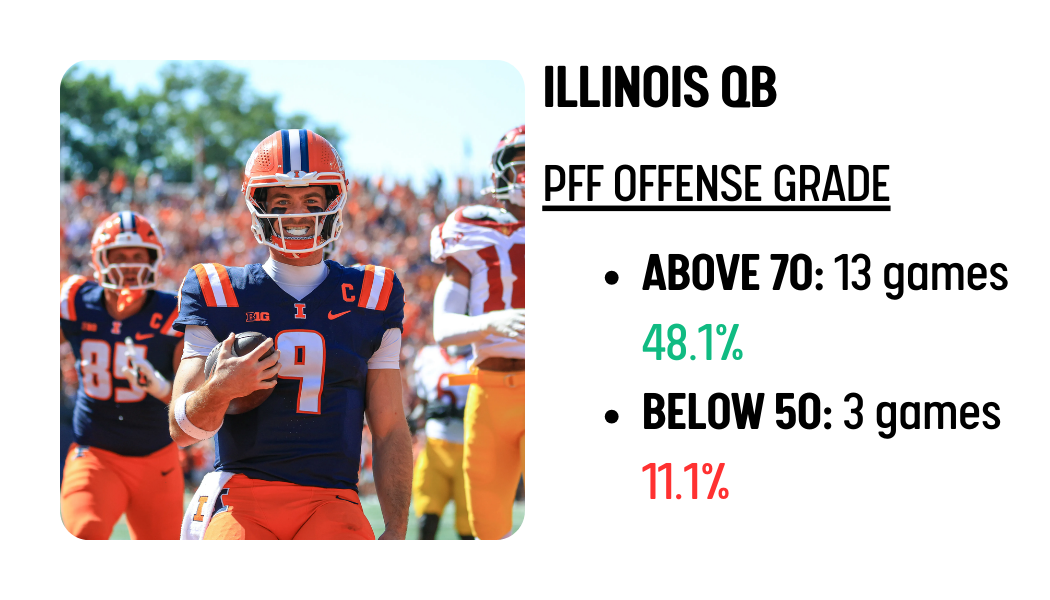
Haynes King
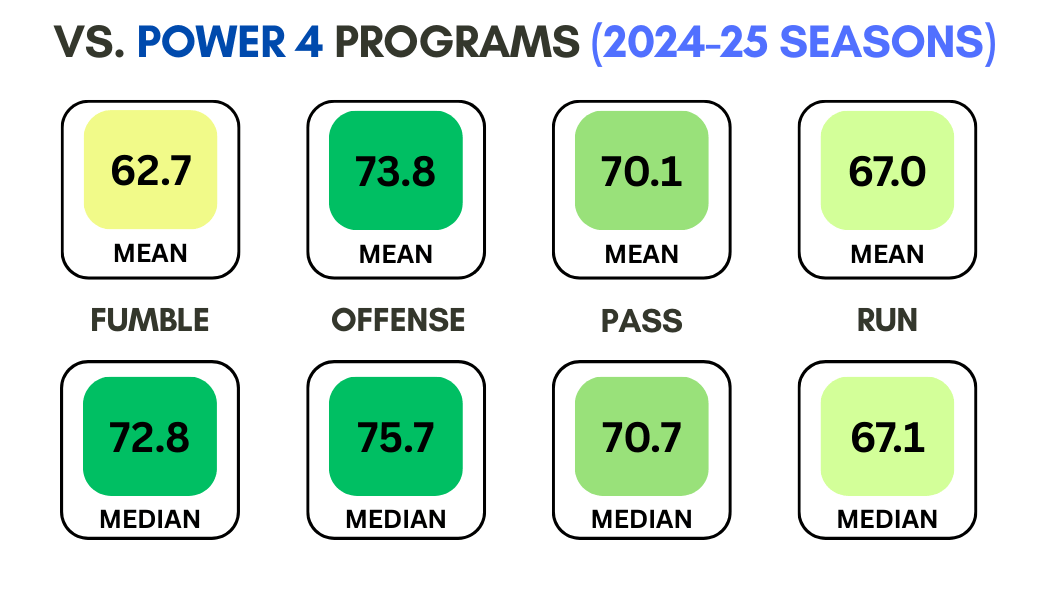
Cade Klubnik
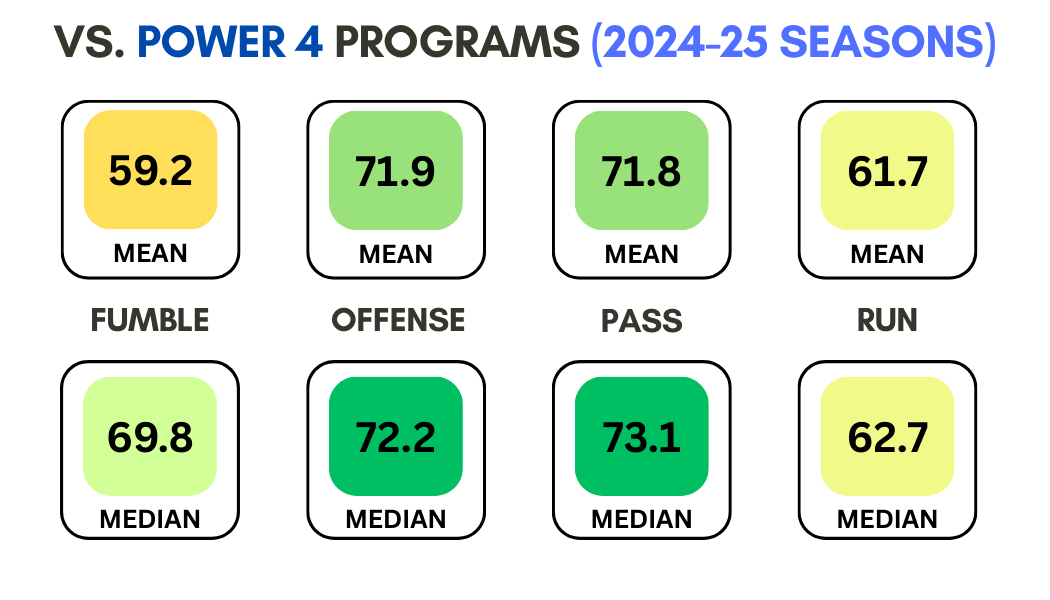
Garrett Nussmeier
Joey Aguilar
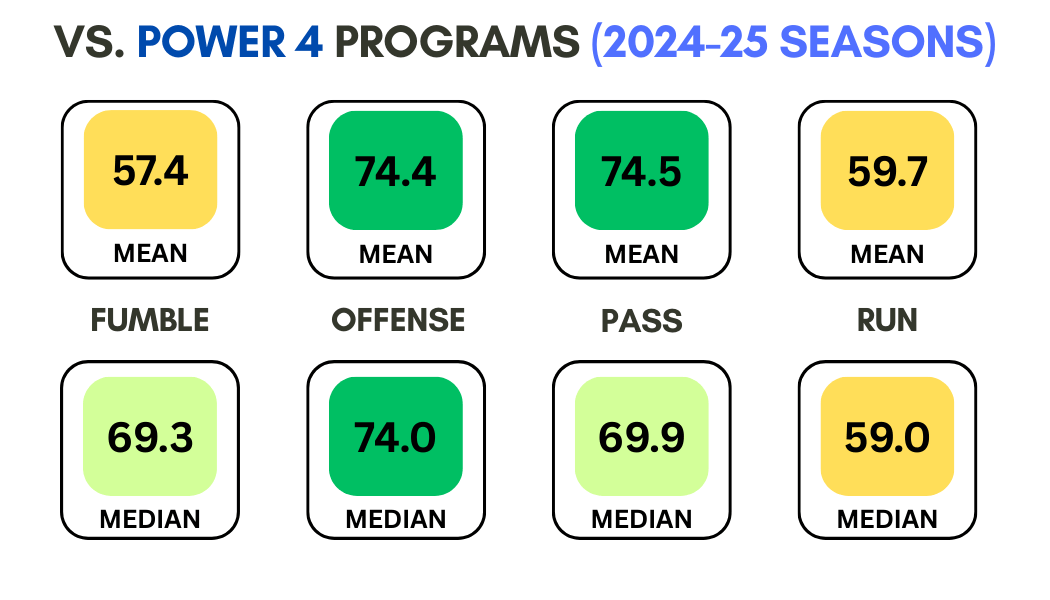
Cole Payton
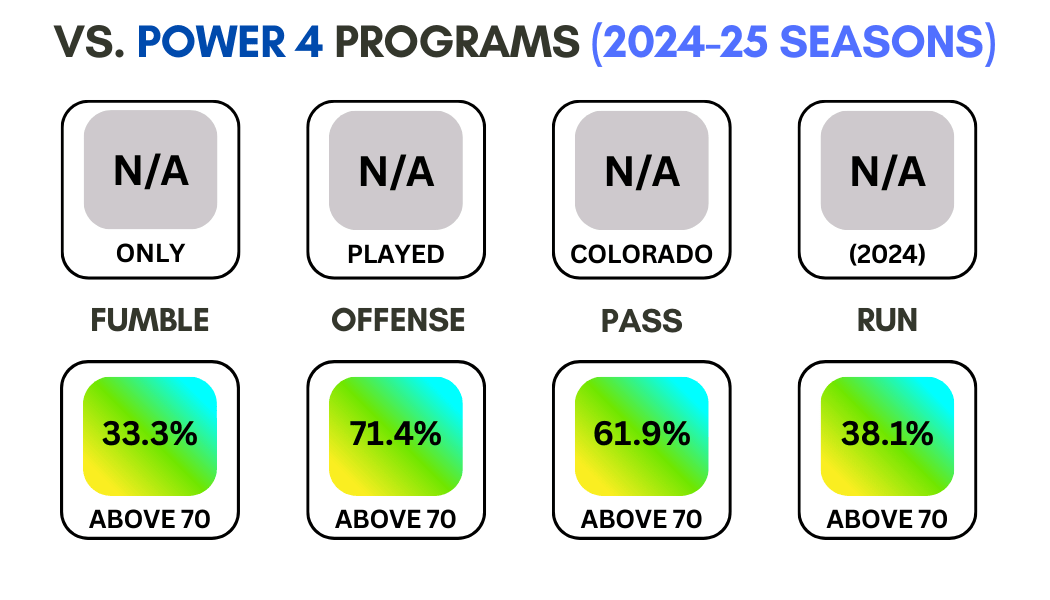
Drew Allar
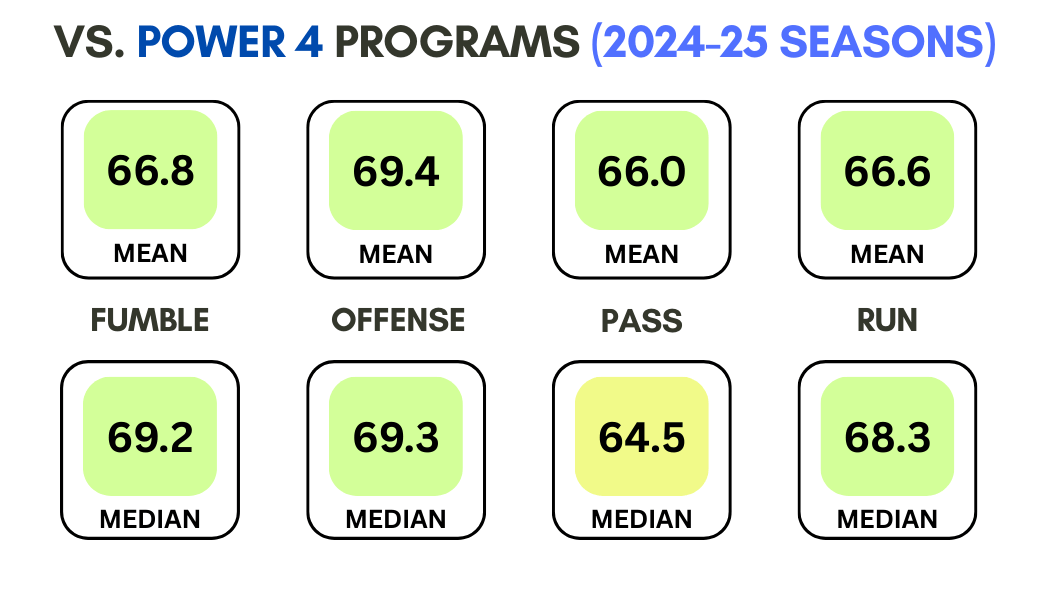
Taylen Green
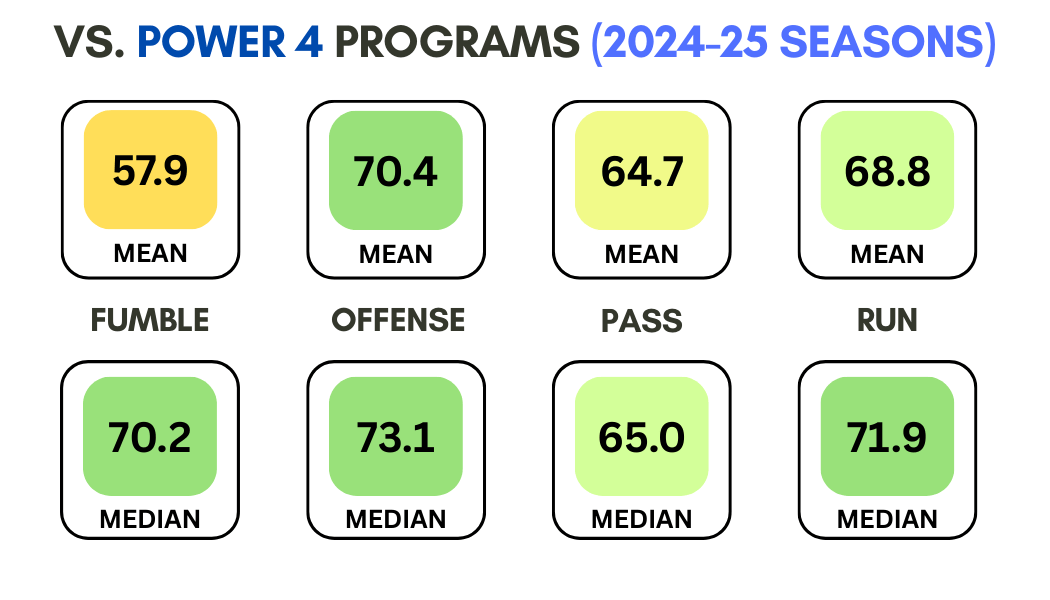
Joe Fagnano
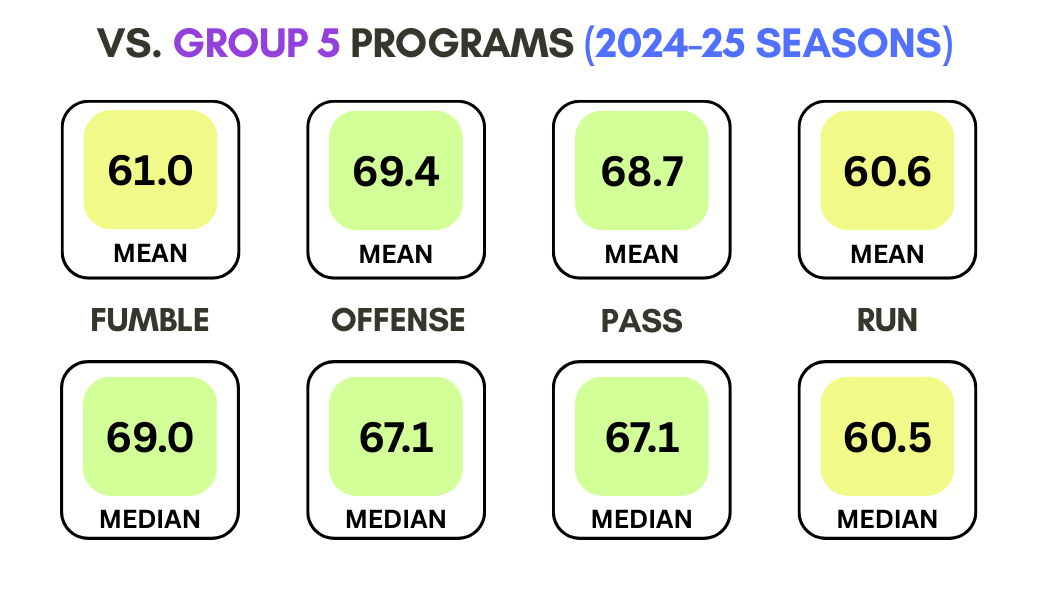
Sawyer Robertson
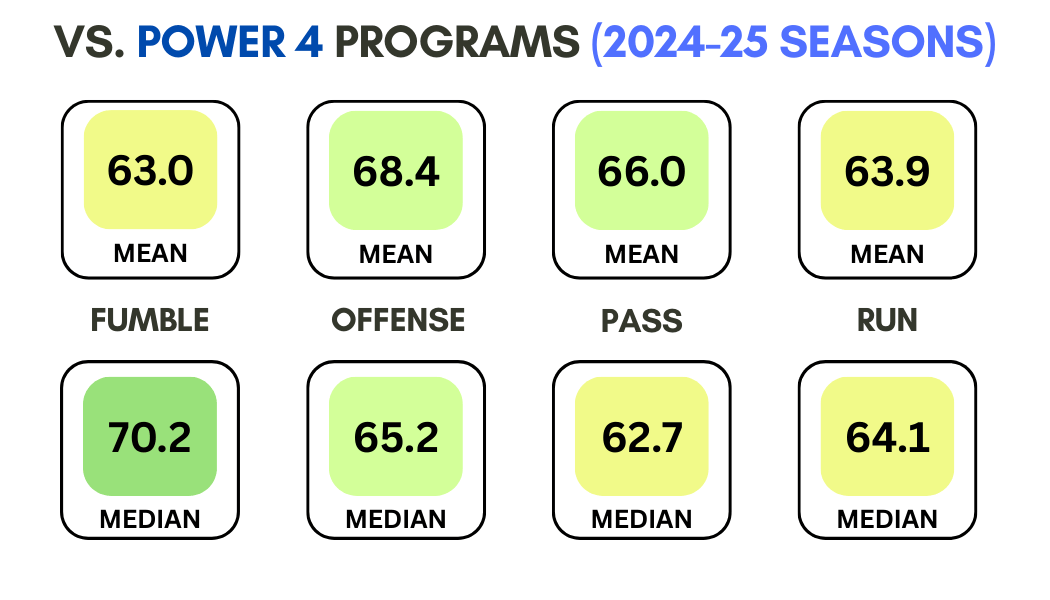
Jalon Daniels
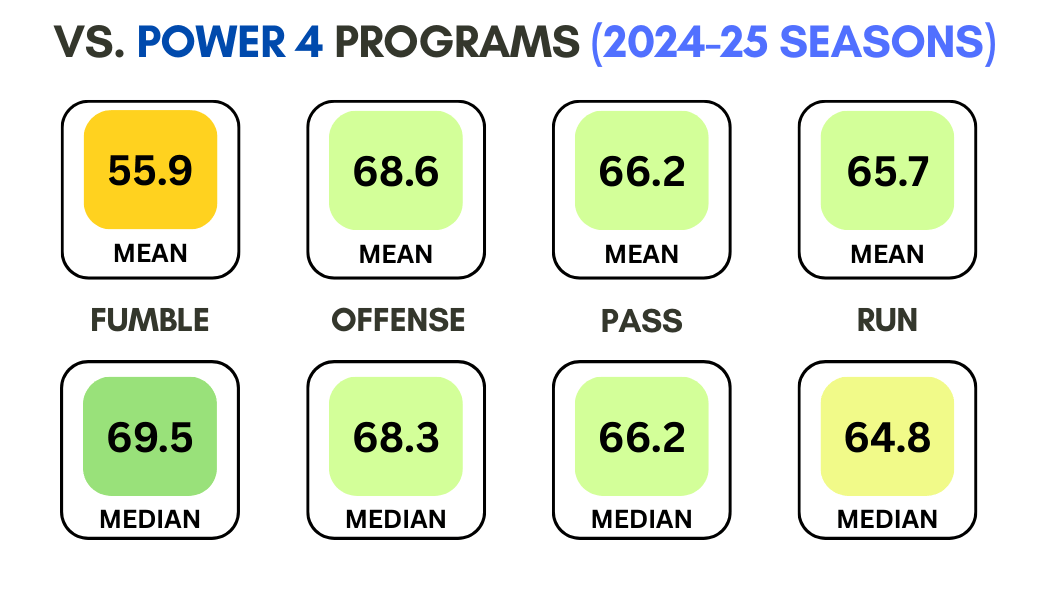
Ty Simpson
Luke Altmeyer
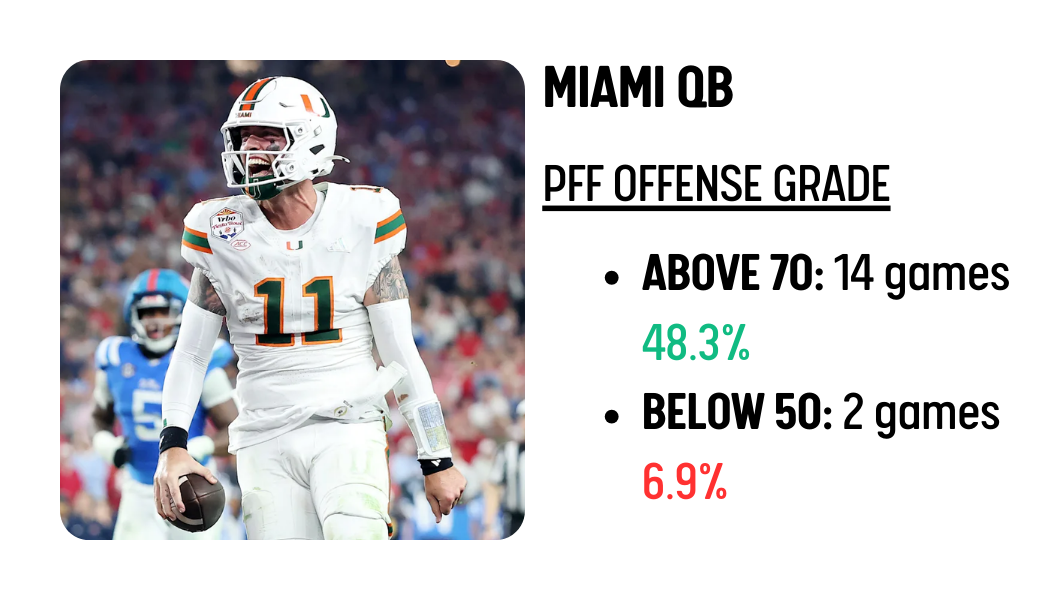
Carson Beck
Behren Morton